
Debugging and Fixing the Galaxy S21 WebView Video Green Screen Issue
Debugging and Fixing the Galaxy S21 WebView Video Green Screen Issue
The Problem: Green Screen Scenario in Android WebView
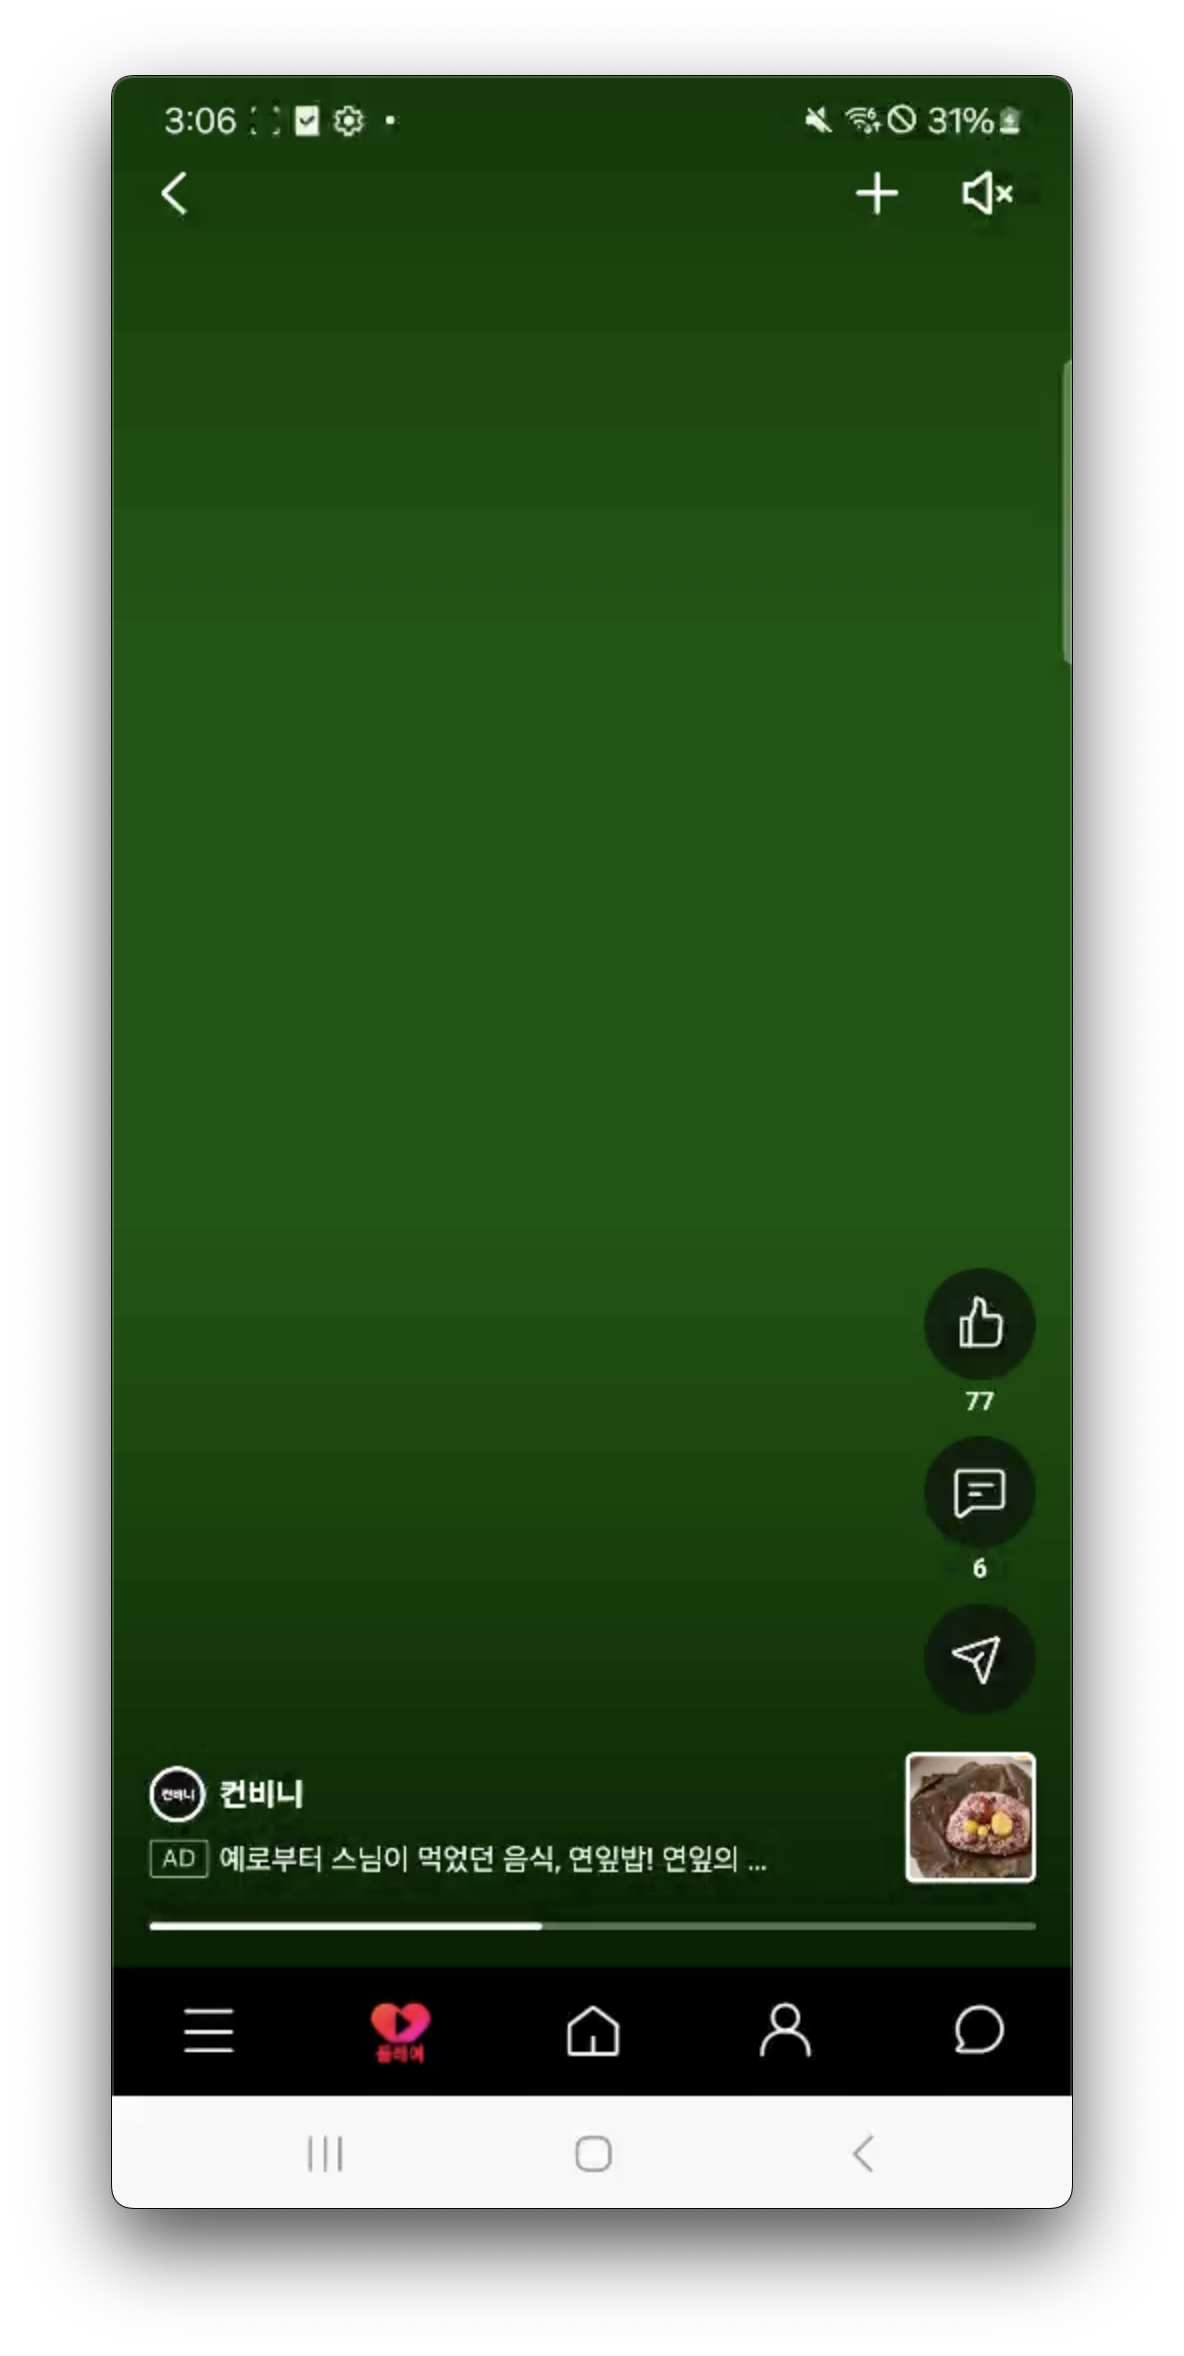
While playing an H.264 codec MP4 video through Android WebView on Galaxy S21 series devices, the video display would suddenly turn green. This phenomenon was reported in particular when playing video through a <video> element inside the WebView, such as AWS IVS-based streaming or an embedded YouTube player. From the user’s perspective, only a green screen would appear instead of the video content, and in some cases the video would shrink into one corner of the screen and exhibit other abnormal symptoms. The issue occurred intermittently and was reported mainly on the Galaxy S21 series (including both the Exynos and Snapdragon versions). There was no problem when playing the same video in another app or browser (for example, the YouTube app itself), but this “green screen” problem only occurred during WebView-based playback.
What was interesting is that these problems began to be reported only after a recent update of Android System WebView (a user’s GitHub issue). Removing the WebView update would temporarily resolve the problem, but once the system automatically re-updated WebView, the problem would reappear. Judging from this, it was presumed to be a compatibility defect occurring between changes in the WebView (Chromium) engine and the GPU environment of a specific device (Galaxy S21).
The Debugging Process: Using DevTools, Media Internals, and Layers
To find the cause of the problem, I made use of Chrome remote debugging tools. First, I enabled WebView debugging on the app under development and connected to it with Chrome DevTools, then focused on rendering-related information rather than console logs or network status.
-
Layers panel: Through the Layers tab of Chrome DevTools, I examined the layer composition and GPU compositing state of the page inside the WebView. Under normal circumstances, the video element exists as a separate Video Layer, and is either composited together with the other UI elements of the WebView or separated out as an Overlay. Observing the Layers tree at the moment the problem occurred, I confirmed that with the video layer shown as an Overlay, the next frame would not be properly filled with content and would instead appear as a blank screen (green). This suggests that the video frame was being displayed via a separate path without being composited through the GPU, and that something went wrong along the way.
-
Media Internals: I opened the
chrome://media-internalspage and analyzed the media pipeline logs of the WebView. These internal diagnostic logs record detailed information such as the media player’s state changes, the decoding codec and output format, and frame rendering timestamps. I extracted the logs and carefully reviewed the type of video decoder (for example, whether a hardware decoder was being used), the YUV->RGB conversion path, and the frame submission/display timing. In particular, when the problem occurred, the decoder had decoded frames normally, but I detected evidence that at the rendering stage the frames were skipped without being displayed on the screen. Looking at the timestamps in the media-internals log, events such as “Video frame submitted to compositor” were missing or delayed at the moment the green screen appeared. From this, I could tell that after the video frames were decoded, compositing was not being performed properly. -
DevTools console and others: No particular JavaScript errors or WebGL issues appeared in the browser console. This increases the likelihood that the cause of the problem lay in the internals of the rendering engine rather than in the application logic. In addition, to check for internal GPU errors, I also checked the Logcat output of the Android device, but no special crash or GLES error was recorded. Instead, in the SurfaceFlinger-related logs, a message similar to “HWC comp FAIL” briefly appeared, which was presumed to hint at a failure in the hardware composer (HWC) path.
How to Analyze chrome://media-internals Logs
The logs extracted from Media Internals are in JSON format, which makes them complex to interpret by eye, so I focused on grasping the key information. The analysis procedure is as follows:
-
Identify the player: media-internals may have multiple Player IDs, so identify the player entry that was active while reproducing the problem. (For example,
player_id: 7, etc.) -
Check the decoding pipeline: Find
kVideoDecoderName,kIsPlatformVideoDecoder, etc. within that player’s log to check the type of decoder. In practice, the log confirmed that under MojoVideoDecoder (Chromium’s decoder wrapper), the MediaCodec hardware decoder had been selected. -
Trace the frame output and display logs: I searched for keywords such as
VideoFrameGeneratedandVideoFrameSentToCompositorto trace the flow of frames. Under normal circumstances, a new frame should be generated and delivered to the compositor at regular intervals. However, in the section where the problem occurred, VideoFrameGenerated kept increasing while the SentToCompositor events were missing. This means that frames were being generated but were not being fed into the compositing stage. -
Check color space/surface information: Through the
kVideoColorSpaceandkOutputFormatlogs, I examined the YUV format and color space conversion information. Here I found that the output format remained YUV (NV12) and that no log of an RGB conversion stage was visible. This suggests that the GPU path involving YUV->RGB conversion was not being activated.
Through this interpretation of the media-internals logs, I determined that in the problematic section the video decoding was normal but that frame processing was being skipped at the compositing or display stage. The next step was to clarify the root cause of why this was happening.
Root Cause Analysis: A Defect in Initializing the Color Space Conversion Path in the GPU Idle State
Putting the debugging results together, the analysis was that the green screen occurs because, when the GPU compositor is in an idle state, the color space conversion path of the hardware video frames is not initialized properly. To put it simply, it is a bug that arose because the mobile GPU’s power-saving mode collides with video overlay processing.
In general, a hardware video decoder (MediaCodec) outputs frames in YUV format. To display them, they must be converted to RGB, and a Chromium-based WebView takes one of two paths depending on the situation:
- GPU path: The YUV data is converted to RGB in the GPU via a shader and composited together with the other UI elements. (the composited layer path)
- HWC overlay path: The YUV data is delivered directly to the display hardware overlay, letting the display device handle the YUV->RGB conversion and compositing. (the overlay plane path)
In the case of the Galaxy S21, the latter—the hardware overlay path—was being used. In the overlay path, on the Chromium side the video is treated as an opaque hole in the page, and the actual video is layered onto the screen through the OS-level compositor (SurfaceFlinger). Because this method does not go through the GPU, it is highly power-efficient, and on mobile platforms such as Android, even when the video is not full screen, aggressive use of overlays for the video can reduce power consumption by up to 50% (Chromium VideoNG). In fact, the Chromium media pipeline is designed to use the platform’s Overlay/Surface capabilities whenever possible.
However, it was precisely this power-saving optimization technique that caused the defect in the S21 environment. The cause of the problem was identified as “an initialization bug in the hardware Overlay path while the GPU is in an idle state.” That is, in a situation where the WebView’s compositor had become idle after a certain period of no work, when a new video frame arrived, there was a phenomenon in which the GPU’s YUV->RGB conversion pipeline did not resume. Due to a defect in the mobile GPU driver or in Chromium’s compositing logic, after the GPU dropped to a low-power mode and was then reactivated, the Overlay path configuration was lost. Because of this, instead of the latest frame, an unconverted YUV plane (a screen that looks green) appeared on the display. A typical symptom is that, when no color conversion is applied to a YUV video, a screen with a purple or green tone is shown, and the green screen looked as if only the Y plane, with the color components (Cb/Cr) missing, was being output.
In addition, the characteristics of the Galaxy S21’s SoC GPU likely also had an influence. The S21 (Exynos 2100 version) is equipped with the ARM Mali-G78 GPU, and the dynamic power management (DVFS) policy of this GPU and its driver operates aggressively, immediately clock-gating/powering down unused GPU functional blocks. When waking the GPU again from this power-saving state, it is presumed that a race condition or a missing initialization occurred between the Overlay configuration that Chromium expects and the actual hardware state. Compositor Idle is a state in which Chromium has internally judged that no rendering update is needed and has briefly stopped generating frames; at this time, the video frames were still being continuously displayed via the OS Overlay. But as the fully stopped compositor and the power-saving GPU responded again to a new frame, the bug in which the color space conversion configuration was not applied for the first frame was triggered.
The Correlation Between Mobile GPU Power-Saving Policy and Compositor Idle
Modern mobile GPUs have power-saving policies that, when graphics computations are not performed continuously, lower the clock or temporarily suspend (idle) cores within a few milliseconds. Chrome/WebView’s compositor likewise rests from new compositing work when no frame update is needed. When these two mechanisms overlap, the following scenario is possible:
-
The UI on the WebView page is static, and the video is being output via Overlay. At this point the Chromium compositor judges that “there is no change in the page content” and switches the compositor into idle mode (that is, it does not create a new composite frame). Even so, the video itself keeps playing through the OS.
-
As the compositing workload disappears, the GPU enters a clock-down or idle mode. Since the video frames are only copied from GPU memory to the display, the GPU’s shader cores and the like may be at rest.
-
At some moment (for example, a change in video resolution, a color space change, or a minor change in the app UI occurs), Chromium tries to perform compositing work again. At this point it tries to wake the GPU to do the YUV->RGB conversion or overlay configuration, but because that path has already been de-initialized on the driver/hardware side, the first frame is not processed properly. As a result, that frame is displayed in the wrong color (green) or dropped.
-
After that, once a change occurs in the UI and the compositor begins to continuously generate frames, the GPU also fully wakes up, normal YUV->RGB processing resumes, and the video is output normally. (This is why the green screen disappears when the user touches the screen or some other animation in the app occurs.)
Through this interaction, we can understand that the bug occurs at the point where mobile GPU power-saving and Chromium compositing optimization intersect. In other words, the first-frame color conversion is skipped in the special situation where “the compositor has no changes while the video runs separately.”
Overlay Plane vs. Composited Layer: A Comparison of Video Output Paths
Summarizing the difference between the Overlay path and the composited path mentioned earlier:
-
Overlay Plane path: The video frame is delivered to a separate overlay of the Hardware Composer (display hardware). Chromium treats that
<video>element area as a transparent hole, and the video content is composited directly by the display controller without going through the GPU. In this case the YUV->RGB conversion is also handled by the display device, so power efficiency is high thanks to reduced GPU load and memory copies (VideoNG). However, for videos with a CSS filter or certain effects applied, the overlay cannot be used, and to ensure there are no synchronous rendering (sync) problems with other elements of the web page, Chromium coordinates frame scheduling with the OS. -
Composited layer path: The video frame is uploaded as a GPU Texture and composited on the GPU together with the WebView’s other elements. At this point Chromium’s GPU process converts the YUV data to RGB via a shader to make a texture, and draws it into the compositing framebuffer as a single layer. Because the video is treated like an ordinary image and is included in the same compositing tree as all the web elements, it follows the page’s repaint rules as-is and is synchronized along with other DOM changes. However, because it requires copying frames into GPU memory and performing color conversion operations, it is a burden in terms of power and performance. Chromium avoids this path when possible and uses Overlay instead, but under overlay-impossible conditions such as screen rotation or overlapping on top of a WebGL canvas, it automatically uses the compositing path.
In this incident, the bug occurred while using the Overlay path, so we can hypothesize what would have happened had it been the compositing path. In the case of the compositing path, the GPU is involved on every frame, so there would be no occasion for the compositor to fall into idle, and even if GPU power-saving did intervene, the YUV->RGB conversion would be performed via a shader on the next frame, so the likelihood of a green screen appearing would be low. (But then power consumption would increase greatly and heat generation would become severe.) As a result, it was a peculiar problem that appeared only in the situation where Overlay was used for power optimization as Chromium intended.
Analysis of the Android WebView Rendering Pipeline
To understand this problem deeply, it is necessary to look at the Android WebView rendering pipeline. WebView runs on the same Blink/Chromium engine as Chrome, but it has the peculiarity of operating embedded as a View of an Android app. Below is a pipeline summarizing the stages by which a video frame in WebView is displayed on the screen:
| Stage | Components and Roles |
|---|---|
| 1. App (Android) | Includes the WebView in the app layout. Allocates a Surface to the WebView from the Android UI thread to enable GPU compositing. |
| 2. WebView (Chromium) | The WebView’s Chromium engine parses/renders the HTML. After creating the <video> tag media element, it initializes the media player (WebMediaPlayer). |
| 3. Video Decoding (MediaCodec) | Chromium uses the hardware decoder through the Android MediaCodec API. It decodes the H.264 stream to produce YUV frames. The output is connected to a SurfaceTexture/Surface, etc. |
| 4. GPU Compositing / Overlay | Chromium’s GPU compositor module performs the compositing work. At this point the video frame is either obtained as a GPU texture via SurfaceTexture or separated out as an Overlay via SurfaceView. In the Overlay case, the GPU compositing result leaves a transparent area where the video is omitted; otherwise, the GPU performs the YUV->RGB conversion and composites. |
| 5. Display Compositing (SurfaceFlinger) | The Android hardware composer (HWC, SurfaceFlinger/DPU) does the final compositing. It merges the app UI layer drawn by the GPU and the video Overlay layer into one and outputs it to the display panel. The whole process proceeds in sync with vsync timing. |
Through the above process, the video becomes visible to the user. The big difference between WebView and desktop Chrome is that WebView participates in the Android system compositor as one component of the app. Desktop Chrome manages all compositing within its own window, but Android WebView is ultimately under the control of SurfaceFlinger. The use of SurfaceView when playing video in WebView is also due to this structure (VideoNG). As a result, WebView has one more layer of depth and requires a dual collaboration between the Chromium compositor and the Android compositor.
Paint, Raster, Composite: Rendering Stages and Dirty Flags
Chromium’s rendering pipeline has three stages—Paint, Raster, and Composite—and when each one runs is managed by dirty flags. The meaning of each stage is as follows:
-
Layout/Paint stage: It computes DOM/CSS changes to generate a display list of what to draw. When painting is needed due to changes in an element’s position, style, etc., the
needs_paintflag is set. At this stage, it only records what to draw in vector form and does not generate the actual pixels. -
Raster stage: Based on the display list prepared in the Paint stage, it rasterizes into actual bitmaps or textures. In GPU-accelerated mode this work is done by the GPU’s rasterizer, and for each layer it may be performed in units of tiles. It runs when the
needs_rasterflag is set, and once rastering is done, the pixel data for that layer is prepared. -
Composite stage: It composites the rastered layers to construct the final frame. Here it is the work of drawing each layer into the screen buffer in the appropriate order and with the appropriate transparency. It runs when the
needs_composite(orneeds_draw) flag is set, and once this stage finishes, one frame’s GPU drawing work is complete and is displayed on the screen.
For performance, Chromium is optimized to perform these stages as minimally as possible. That is, it performs only the subsequent stages depending on which stage’s dirty flag is turned on, and if there is no change, it skips that stage. For example, if there is simply a scroll or only a transform, it merely re-composites the existing raster result without layout or paint. Conversely, if there is a change in the DOM structure, it paints again from the start, and as a result it continues on through raster and composite. Put simply, if a change occurs in an earlier stage, the entire chain of later stages runs, but if the change is localized, only the later stages run (Animating and Compositing). With this dirty-flag strategy, unnecessary computation is reduced and the frame rate is raised.
In this case, the problematic situation was that, in terms of the WebView content, there was no change at all to paint/raster (the video is handled via Overlay), and the composite stage also stayed the same, so from Chromium’s standpoint not even needs_composite occurred. In other words, it became an Idle state in which the dirty flags of all rendering stages were false. Normally, it would seem that the video frame update itself should trigger needs_composite, but as explained earlier, in the Overlay path the video frame changes are transparently invisible to the Chromium compositor. On the WebView’s Layer Tree, there is a possibility that once the video was confirmed as an Overlay, it was regarded as continuing to be the same external layer unless there was a separate signal. In the case of Desktop Chrome, when a video plays it internally invalidates per frame, but in WebView it may not do so for optimization reasons, or it may have assumed that the Android system manages it. As a result, the WebView’s compositor layer tree behaves as if it had stopped, and the video runs outside the WebView (at the OS level), making it vulnerable to the GPU initialization issue mentioned earlier.
WebView vs. Desktop Chrome: Differences in the Layer Tree and Optimizations
WebView and desktop Chrome share the same Chromium engine, but differences exist in the layer tree composition and optimization behavior. In the case of desktop Chrome, the browser itself operates as an independent Window within the overall system, and the Chrome compositor oversees everything. WebView, on the other hand, is included as a View of an Android app, so it is a layered structure in which Chromium’s compositing output is merged again into the Android View system.
This difference has the following effects:
-
Layer tree structure: The Layer Tree inside WebView is regarded as a single surface to be submitted to the Android SurfaceFlinger at final output. On the desktop everything up to final output is under Chromium’s management, but WebView delegates the final compositing to the OS. Because of this, there can be compositing elements that Chromium is not aware of (for example, an Overlay). In this case, in the WebView’s layer tree, an external Surface was shown in the place of the video layer, and the actual frame updates were done on the OS side.
-
Rendering scheduling: When playing video, desktop Chrome uses things like
requestAnimationFrameto keep producing composite frames at 60fps, or at the very least it sends even an empty frame to participate in vsync. WebView, however, due to the nature of the host app and Android, rests the compositing thread when there is no active UI update. This is for the sake of battery savings, but at this time, if the video is handled via Overlay, the WebView side easily judges that it has nothing to do. In other words, a subtle mismatch arises in which WebView judges that “there is no UI change for me to draw” and stops compositing, while the video keeps running. This optimization is generally fine, but as in this case, the problem could erupt at the moment the compositor resumes. -
Optimization weak points: Because WebView is an embedded engine, there are limits to controlling the whole browser. For example, desktop Chrome can apply its own invalidation according to UI events or video frames even while using GPU overlays, but WebView depends on Android system signals. As a result, in the WebView environment some of Chromium’s optimizations may be applied excessively, or conversely may overlap with OS optimizations to create unexpected situations. This green screen phenomenon can be seen as exactly that kind of blind spot in WebView’s optimization. In a part where the WebView engine was confident that it was “sufficiently optimized,” a synchronization issue actually occurred.
In summary, in desktop Chrome the layer tree is entirely within Chromium, so the video frames also blend naturally into the compositing flow, but in WebView the layer tree is bifurcated and a gap in compositing optimization arises, which gave rise to this kind of problem.
The Solution: Forcing Composite Invalidation Through Continuous Rendering
The root cause was a bug on the Chromium (WebView) or GPU driver side, but it was not something the application developer could fix immediately. While waiting for a Chromium source fix or a driver update, as a temporary measure I tried the approach of “making rendering always stay alive.” Specifically, by overlaying a small transparent spinner animation component on top of the WebView, I kept the compositor continuously busy.
In this app, which was implemented based on React, it was relatively easy to add a small loading icon that spins with a CSS animation at the very top of the video view. Its size was made very small and transparent so that the user would not perceive it visually, but on the DOM it is a continuously changing element. By doing this, Chromium ends up generating compositing work every frame. That is, the compositor no longer stays in the idle state for a long time; instead, the needs_composite flag is continuously set, which amounts to maintaining the FPS. If the green screen phenomenon still occurs even after adding the spinner, the problem is resolved by making the spinner’s radius smaller. The smaller the spinner’s radius, the more busily the GPU keeps running without any chance to rest.
As a result of applying this measure, I confirmed that the green screen phenomenon was no longer reproduced on the Galaxy S21 device. Before adding the spinner, the green screen had appeared after tens of seconds to a few minutes of playback, but after adding it, it did not occur even after continuous playback for several hours. This is because the small animation always keeps the GPU awake, thereby preventing in advance the very “first-frame color conversion omission while the GPU is idle” situation that was the cause of the problem earlier.
Of course, this solution has a strong character of being a temporary fix (hotfix), and fundamentally a bug fix on the WebView/Chromium or driver side is the ultimate solution. However, since in practice one must respond immediately to such graphics bugs, a workaround that intentionally imposes a compositing load to circumvent the problem can also be a useful strategy. Fortunately, the overhead of a single small spinner is negligible on modern mobile devices, and it had no significant impact on power consumption either. On the other hand, since this keeps the WebView’s rendering loop running, one must take into account that requestAnimationFrame and the like stay continuously active. If the app under development is extremely sensitive to battery consumption, this approach should be applied cautiously, but in a context that already has inherently high-load work such as video playback, I judged that the side effects are minor.
To sum up, “eliminating the rendering idle state to circumvent the problem” was the practical solution to this green screen issue.
Similar Cases and Future Directions for Improvement
I investigated whether similar cases had ever been reported on other devices or in other environments. In early 2024, on some developer forums there were reports of experiencing a green screen when playing video after a WebView update. In those cases, too, a WebView bug was pointed to as the culprit, and the answers were to roll WebView back or to wait for an update. Besides the Galaxy S21, users of devices such as the S20/S22 have also shared, on Reddit and elsewhere, the phenomenon of colors going strange or being distorted to green/purple when playing embedded video. This suggests that it may fundamentally be a problem common to the Chromium engine. However, although we cannot be certain whether all the cases share the same cause, they are similar in that they are video output bugs that occur when hardware acceleration and power-saving features are intertwined.
To fundamentally solve this problem, what would be needed on the Chromium side is an improvement to the logic that wakes the compositor when a video frame is updated, or a safeguard for when the first frame’s overlay resumes. For example, when the compositor has rested for a certain period on a video frame operating via Overlay, it would be possible to respond by forcibly rendering once on the GPU on the next frame to initialize the color space conversion path. Looking at the actual Chromium issue tracker, there are cases of similar-context bugs that were reported and patched (for example, the first-frame black screen issue, etc.). If such improvements are made, then in the future the problem will be solved without an application-level workaround.
This case shows how complex the subtle interaction between WebView and hardware acceleration in a mobile environment is. When developing a hybrid app built with React or an app that utilizes web content, you must understand the optimization behavior of the browser engine in order to respond to unexpected bugs. Using tools such as DevTools and chrome://media-internals in the debugging process was a great help in clarifying the source of the problem. In particular, media-internals shows what is happening inside the media pipeline, so I once again felt that it is an essential tool for solving video/audio-related problems.
Finally, the continuous-rendering technique (adding a spinner) that was applied temporarily can also be applied to other graphics glitches. For example, if WebView content stops after a certain time on some devices, you can put in an invisible animation to force it to keep running. Such a trick is not a fundamental solution, but it can be a practical way to circumvent a bug without harming the user experience.
Conclusion
The video green screen problem on the Galaxy S21 series WebView was a peculiar bug that occurred at the boundary between GPU power-saving and Chromium compositing optimization. Through thorough debugging I inferred the cause, and mitigated the problem with the creative solution of adding a small animation component. Through this experience I was able to further develop my ability to understand complex rendering pipelines and respond to bugs, and I also prepared countermeasures in case of similar issues in the future. I hope this case will be a useful reference for developers who deal with WebView and hardware acceleration.
References
- Green Screen Android System Webview · Issue #1116 · PierfrancescoSoffritti/android-youtube-player · GitHub
- Deep-dive: VideoNG , Chromium , Chrome for Developers
- Animating and Compositing , Web Browser Engineering
EOD
20250530

Leave a comment