
Let’s Debug Node.js with Chrome DevTools Using ndb
A new Node.js debugging tool(?)
A new feature in Google Chrome 70 for debugging Node.js has arrived. It’s about integrating ndb with Chrome DevTools. This approach has several advantages claimed by the Chrome team (you can edit files in DevTools, and so on), but above all,
It’s great because you can debug using the Chrome DevTools you’re already familiar with!
Of course, you can debug Node.js with Chrome DevTools even without ndb (see this link). But together with ndb, you can use even more powerful debugging features. Let’s start with the installation.
Installation
Open bash or cmd and enter the following script. Naturally, Node.js must already be installed. It should be v8.0.0 or higher, and v10 or higher is even better.
npm install -g ndb
For Windows users, the script above may throw an error. In that case, run Powershell in administrator mode and run the script below.
npm install -g windows-build-tools
ndb is now installed.
Running
Move to the location of the Node.js project you want to debug and run the script below.
# server.js is the name of the file to run
ndb server.js
If you want to debug the installed packages as well, run the script below.
ndb npm start
If it runs properly, Chrome DevTools will pop up.
Start debugging
If you’re going to debug a web application framework like express, you can start debugging by connecting to the URL of the local server that’s running. Of course, you have to set breakpoints.
If it’s not a web app but just a server-side app you run directly, and you ran ndb with ndb npm start, you need to click Run this script in DevTools.
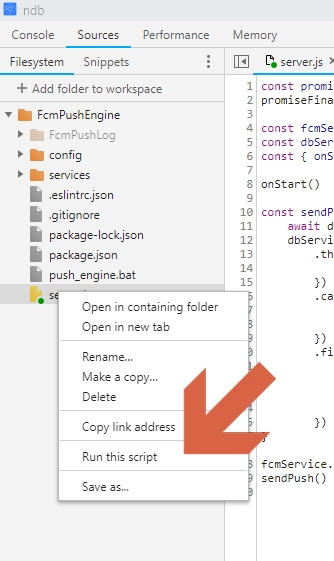
Of course, you also have to set breakpoints.
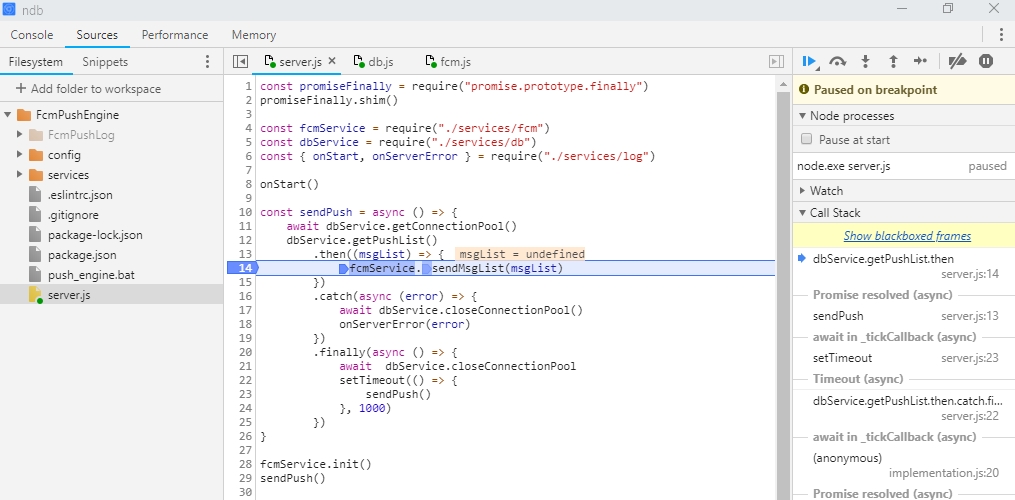
Done!
Reference: https://nitayneeman.com/posts/debugging-nodejs-application-in-chrome-devtools-using-ndb/

Leave a comment